Case Study
A model that ties media spend to sales potential
3 min read | Media efficiency | Marketing Workflow Transformation

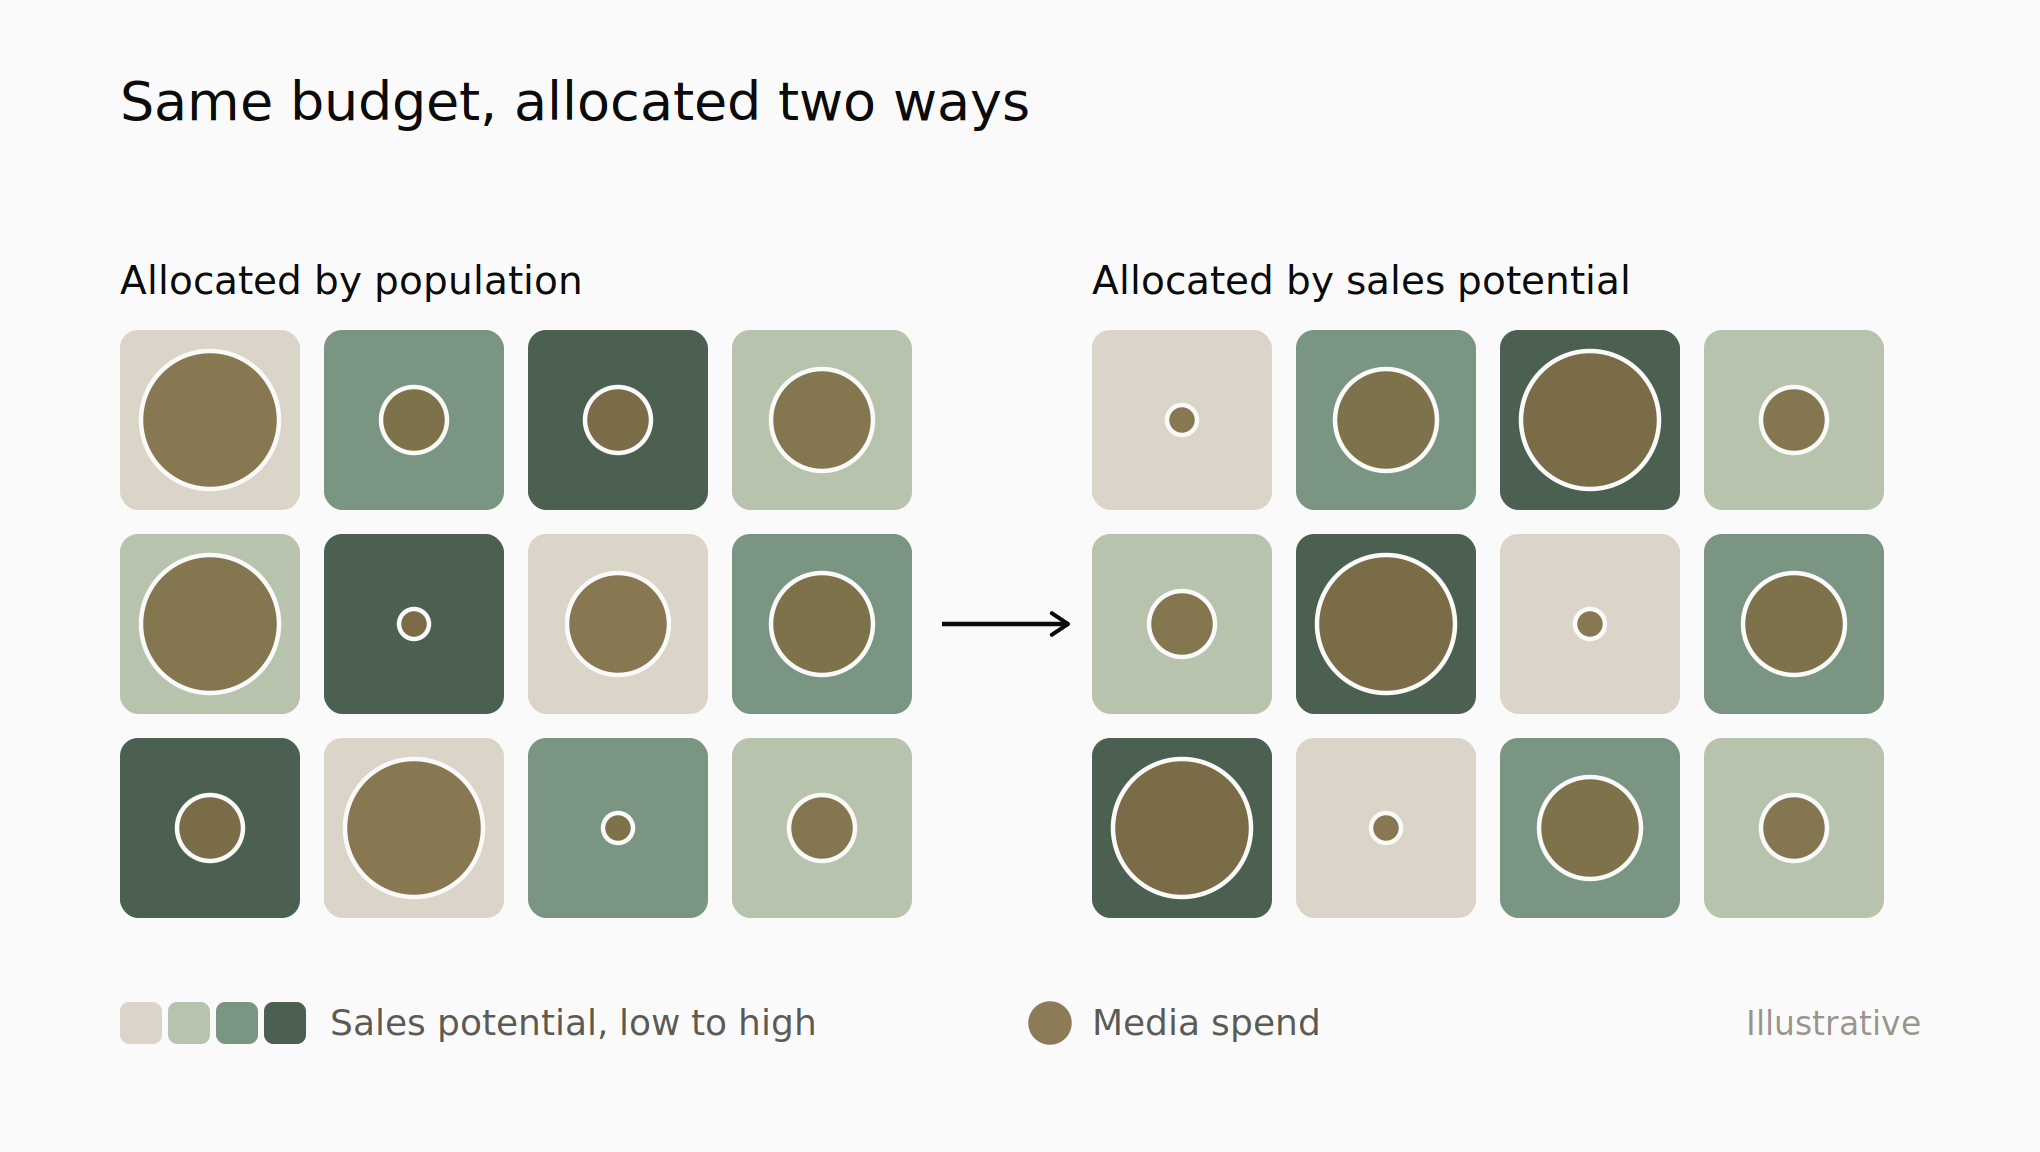
A global drinks company was allocating media budget by population size. We built a model that scored each area on its likelihood to drive sales, and used it to steer where the spend went.
Results
There was no extra budget behind this. The same money, reweighted towards the areas the model rated highest, returned twice what business as usual did. Cost per thousand fell 35% and sales rose 7%.
7%
Sales uplift
2x
Return vs. business as usual
35%
Lower cost to reach the same audience
The challenge
Media budgets are usually split by population. More people in an area, more money against it. The logic is old and it feels safe.
It also misses where the sales are. An area can hold a large drinking-age population and still convert poorly, while a smaller one sells well above its size. Spend mapped to headcount backs the first and starves the second.
The waste is hard to spot, because the reporting looks healthy. Impressions get delivered, reach targets get hit, the dashboards turn green. What the standard view rarely shows is how spend in each area lines up against the sales it produces. So money keeps flowing to places that look big on paper and sell little in practice.
At national scale, across dozens of areas, that adds up to a real share of the budget sitting where it returns least.
What Pivot & Co did
We built a model that scored each area on how likely it was to turn spend into sales, and showed how that score could steer media buying.
The score came from the client's own sales history rather than population. Each area was rated on how it had actually performed, so a place that sold well earned a higher weighting and a stronger claim on budget. We worked at a local level, fine enough to separate strong and weak areas that a regional average blurs together.
That 'attractiveness' score then fed into media bidding. As campaigns ran, spend could tilt towards higher-scoring areas instead of following a split fixed months in advance, so the buying tracked where the sales potential actually sat.
We built it to be used again. The same method picks up fresh sales data and re-scores, so it holds across campaigns without a rebuild each time.
What feeds the score and how it's weighted is where the value sits, so that stays between us and the client. The principle is the part worth sharing: spend follows sales potential, measured from real performance.